Looking for Image Charts Lifetime deal?
How to get the Image Charts lifetime deal
If you would like to buy a lifetime deal on Image Charts, make a request here. When the deal is live, you will receive an email from us notifying you about it.
You can increase the chances of getting this lifetime deal by sharing this page with your friends and colleagues and encouraging them to make a request for Image Charts LTD.
The more requests we have, the better the chances of securing the deal for you.
Request
⇢
Share
⇢
Get Notified
Share with your friends to reach the goal!
Share and get your friends to request this deal to increase the chances of getting this lifetime deal
What is Image Charts?
Image Charts is a chart generation API that allows developers and businesses to create charts as images using simple URL requests.
It enables users to generate bar charts, pie charts, line charts, QR codes, and more without needing complex front-end libraries or rendering engines.
Image Charts covers multiple parts of a data visualization workflow—from generating charts dynamically using data, customizing styles like colors and labels, to embedding charts directly into emails, reports, dashboards, or web pages.
Image Charts Plans and Pricing
Image Charts Use Cases
Automated Reporting: If you need to generate reports regularly, Image Charts allows you to create charts dynamically using live data. This makes it easy to include up-to-date visuals in automated reports without manual effort.
Email Embeds: Embedding charts in emails is usually difficult due to rendering limitations. Image Charts solves this by generating charts as images that can be easily embedded in emails, ensuring consistent display across all devices.
Dashboard Visualization: Developers can use Image Charts to power dashboards with real-time charts. By generating images via API, it simplifies the process of displaying data without heavy front-end dependencies.
Data Visualization at Scale: For SaaS platforms handling large volumes of data, Image Charts enables scalable chart generation. It can create thousands of charts on-demand, making it ideal for multi-user applications.
Integration with Automation Tools: Image Charts integrates with tools like Google Sheets and Zapier, allowing users to automate chart creation based on triggers or data updates. This reduces manual work and improves efficiency.
Who is Image Charts ideal for?
Developers & Engineering Teams: Image Charts is ideal for developers who need a simple way to generate charts via API without building complex front-end visualizations. It allows quick integration of dynamic charts into applications using minimal code.
SaaS Companies & Product Teams: For SaaS platforms that need to display user data visually, Image Charts provides a scalable solution to generate charts on demand. It helps deliver personalized dashboards and reports without maintaining chart-rendering infrastructure.
Marketing & Analytics Teams: Marketing and analytics teams can use Image Charts to create visual reports and performance charts automatically. It simplifies sharing insights through easily embeddable chart images in reports and presentations.
Businesses Sending Automated Emails: Image Charts is perfect for businesses that send automated emails with data insights. Since charts are generated as images, they can be reliably embedded in emails across all devices and clients.
No-Code & Automation Users: With integrations like Zapier and Google Sheets, Image Charts is ideal for no-code users who want to automate chart creation based on data updates without writing code.
Image Charts Key Features
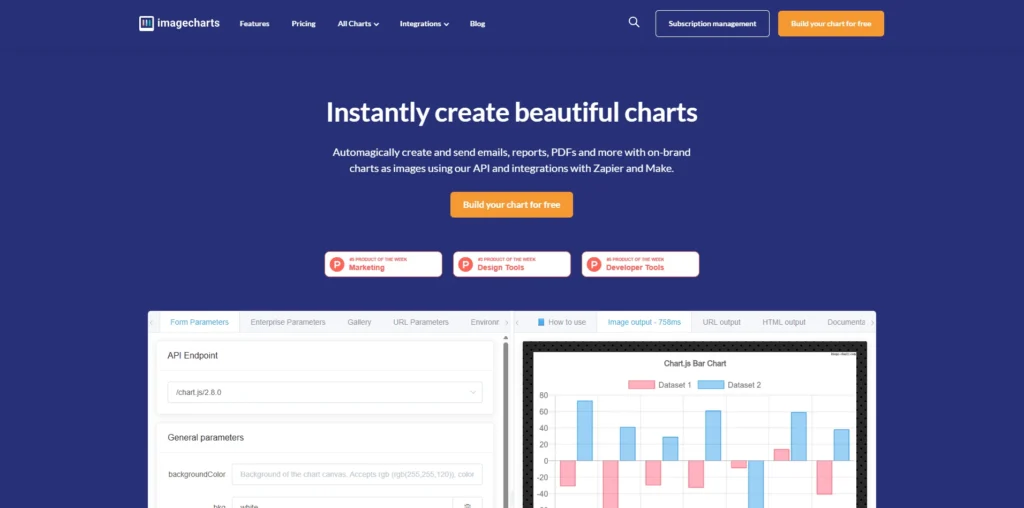
URL-Based Chart Generation API
Support For Multiple Chart Types (Bar, Line, Pie, QR, etc.)
Customizable Chart Styling (Colors, Labels, Fonts)
Dynamic Data-Driven Chart Creation
Image Output Formats (PNG, SVG, GIF)
Animated Chart Support (GIF)
High-Performance, Sub-Second Rendering
Integration With Automation Tools (Zapier, Make)
QR Code Generation Capability
Global CDN And Multi Data-Center Delivery
QuickChart: a popular API for generating charts as images using Chart.js, widely used for automation and reporting.
Chart.js: one of the most widely used open-source libraries for creating interactive charts on the web.
Google Charts: a free tool by Google that provides interactive charts and integrates well with other Google services.
Highcharts: a powerful and flexible charting library used for advanced data visualization in web applications.
Plotly: a comprehensive platform for building interactive charts and dashboards, popular among developers and data scientists.
Image Charts stands out for its simplicity and API-first approach, but several strong alternatives offer more interactive or customizable charting capabilities. The right choice depends on whether you need lightweight image-based charts or full-fledged interactive data visualization tools.
Image Charts alternatives and competitors
Why we can get Image Charts
Be the first to know when Image Charts LTD goes live!
At Prime, we do the impossible very often!
What LTD fans say about Prime Club:
Prime Club is my go-to for LTDs. Dev curates quality lifetime deals, including big brands like SpyFu. Excellent platform and great value!”
Prime Club definitely has a bright future and eventually will become the most trustable brand in the Lifetime deal community.
You’ll be the first to know the moment they launch!
Request for a Image Charts lifetime deal
Be the first to know when we launch this deal
- Terms of use
- Privacy Policy
- ©2026 | Crafted with love